Front-End Development:
Design
The presentation layer of the website was designed with the Bootstrap front-end framework, HTML and CSS. The user interface is simple and easy to use, there has been multiple revisions based on user feedback. The outcome is a clean design where the user defines the beam model unit system, beam length, supports types, and loading conditions, with panels on the left of the page. These panels with the aid of images, are intuitive to use. On the right of the panels, there is a canvas element that shows a summary of the beam model. The design of Optimal Beam web application can be seen on figure 10.
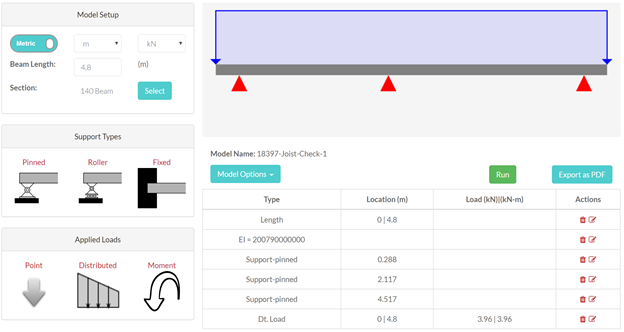
Figure 10: Optimal Beam Application Interface.
Javascript :
JavaScript enables the functionality of Optimal Beam and allows it to be an interactive web application. As the user starts defining the beam model, at each step, they see a visual representation of the action they completed. As an example, when the user adds a new loading condition, the canvas element is updated to show a simple 2-D beam model showcasing all the support types, loading types, and their respective locations. A table is also updated to show a summary of all the beam model inputs. Even after a beam input has been added to the model, the user has the option to edit or delete that specific input, which would automatically update the canvas drawing and table.
The user has the option to choose which unit system is used for the beam model either imperial or metric units. Even when the beam has been modelled in one unit, with a flick of a switch, the model units will be switched, and all user inputs will be updated automatically.
Once the beam model has been defined and completed, the user would click the “run” button and with the use of Ajax calls and PHP, this would call the C# application and a JSON string is returned. The JSON string has all the beam model results such as support reaction forces and all the data points for the shear, moment, slope, deflection, bending stress, and shear stress diagrams.
With the use of d3.js JavaScript library, the charts are produced, and inserted in the web page as an SVG element. The charts are interactive and provide the user with the x and y coordinates wherever the mouse is hoovering. Figure 11 shows this functionality.
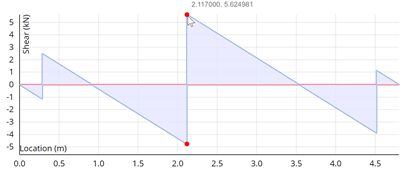
Figure 11: Interactive Shear Diagram on Optimal Beam.
The user now has access to all the results required for the design process of a beam. The results can be exported into a pdf file format which is then saved locally on the user’s local drive. The PDF file is generated with the aid of jspdf.js library. In the appendix, there is a sample of beam model PDF output from optimal beam, these outputs are professionally formatted and can be used for calculation packages.