Step 6 - Interpret Results:
When you’ve finished building your model, you can solve for results by clicking the Run button located right below the free body diagram.
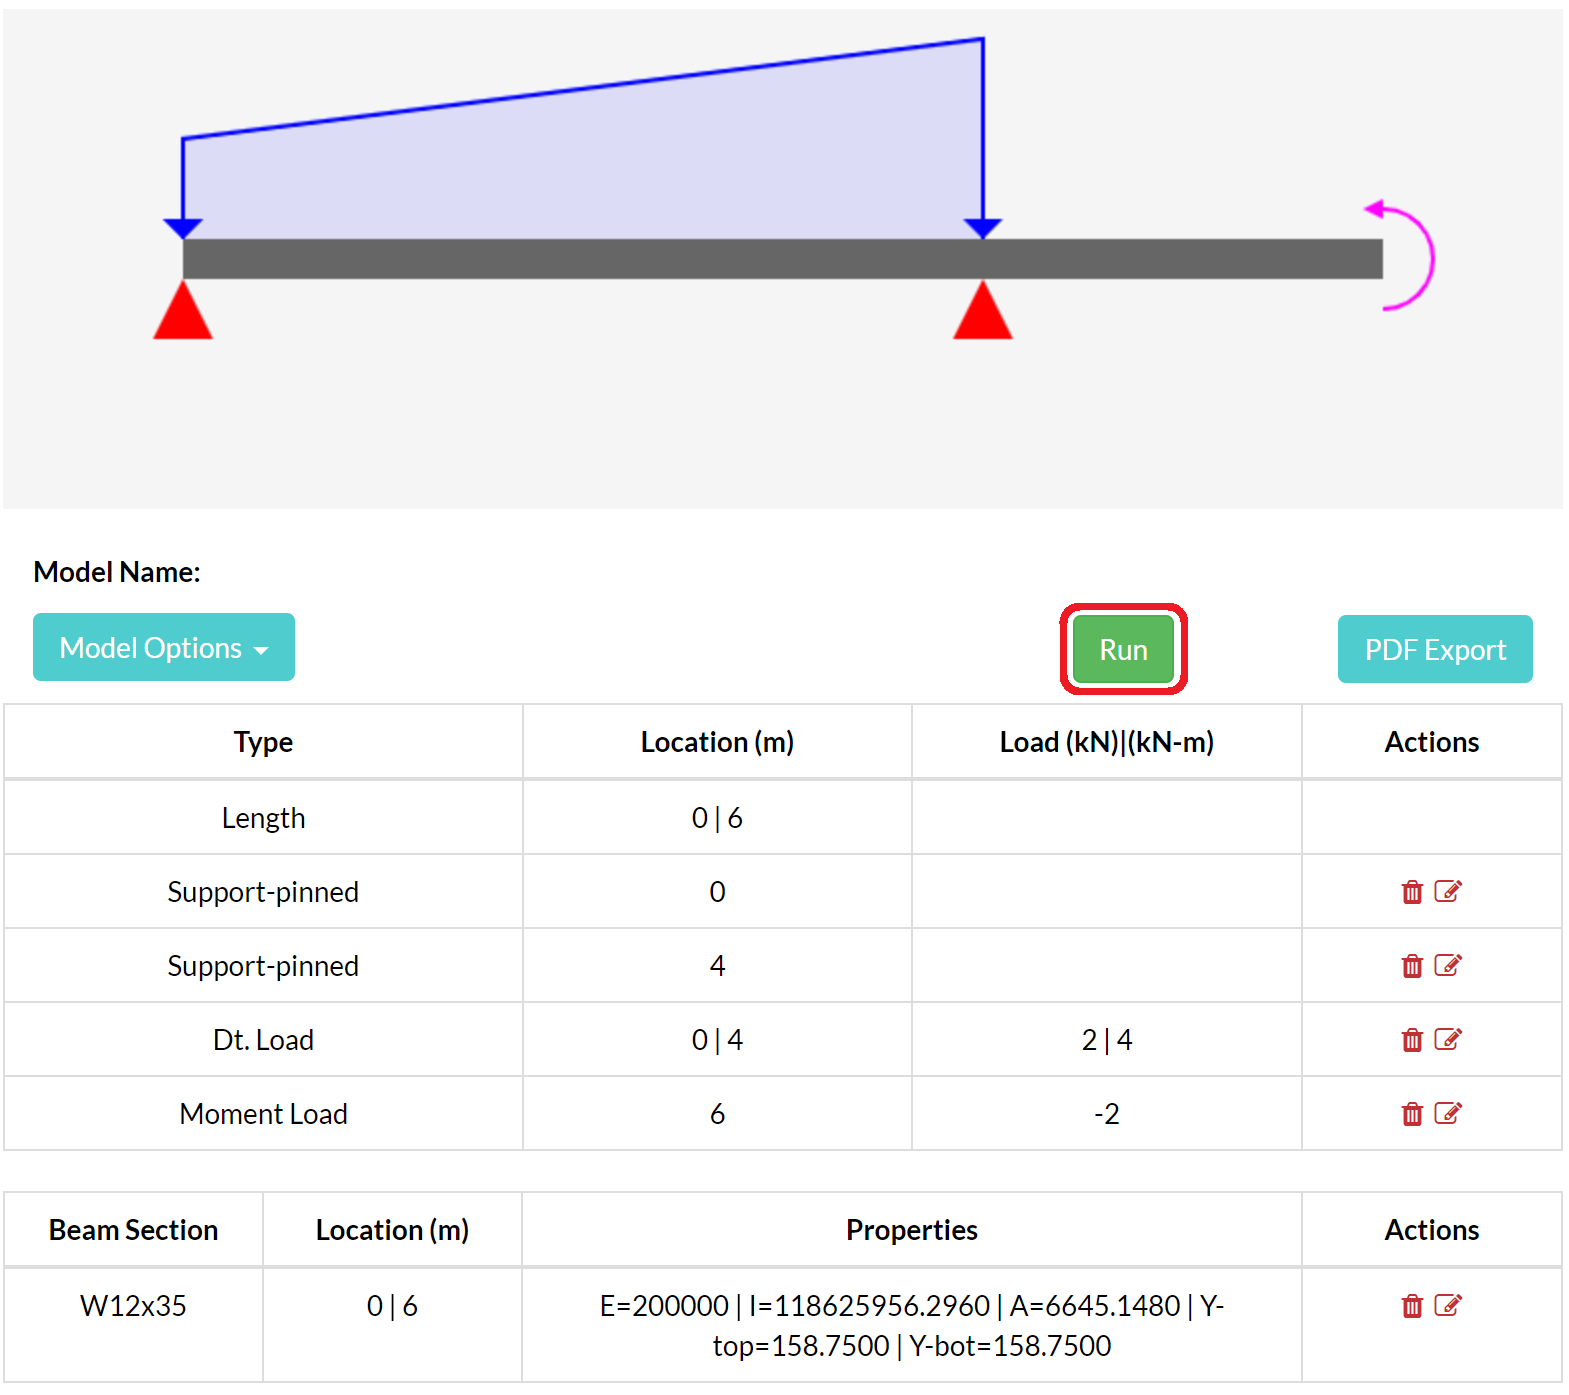
Support Reactions:
A force reaction that is positive means the reaction is downwards. A force reaction that is negative means the reaction is upwards.
A moment reaction that is positive means the reaction is clockwise. A moment reaction that is negative means the reaction is counter clockwise.

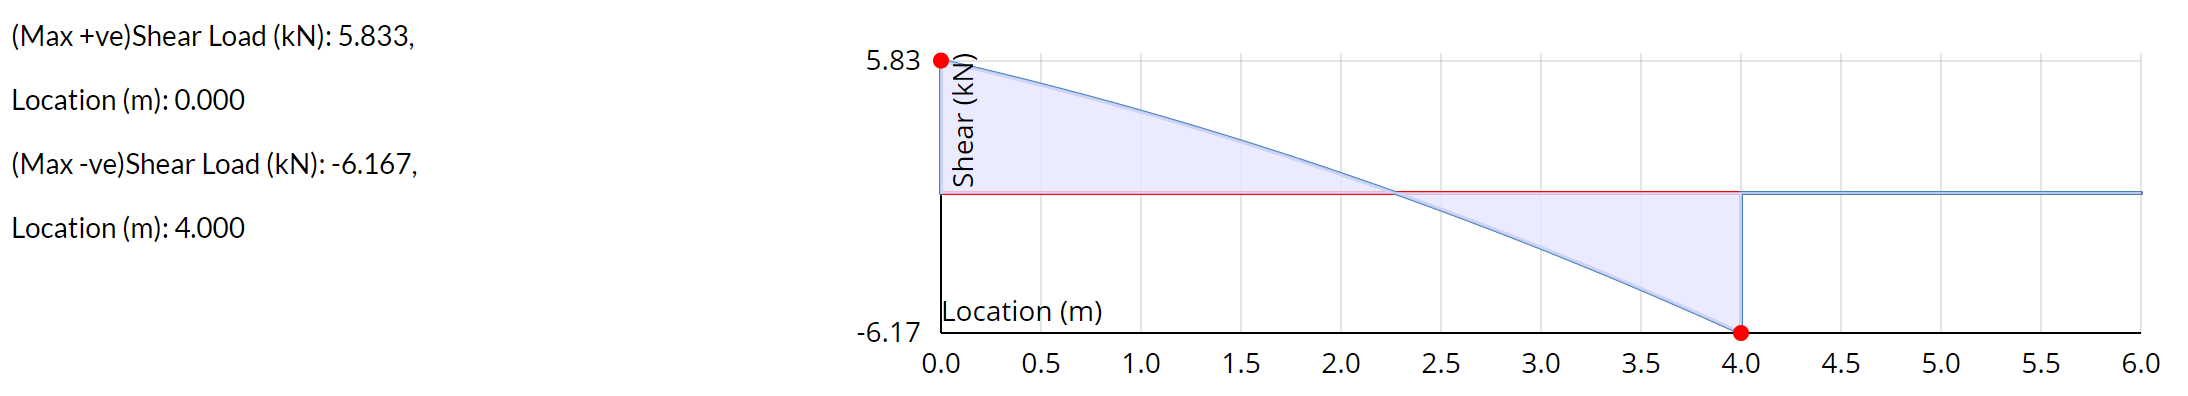
Shear Force Diagram:
The Shear Force Diagram of your model is presented with the results. The shear force values are plotted against the length of the beam.
The diagram has the extreme shear force points shown with red dots. A summary of the extreme points is shown to the left of the diagram.
You can determine the shear force at any point along the beam span by hovering the mouse along the diagram.
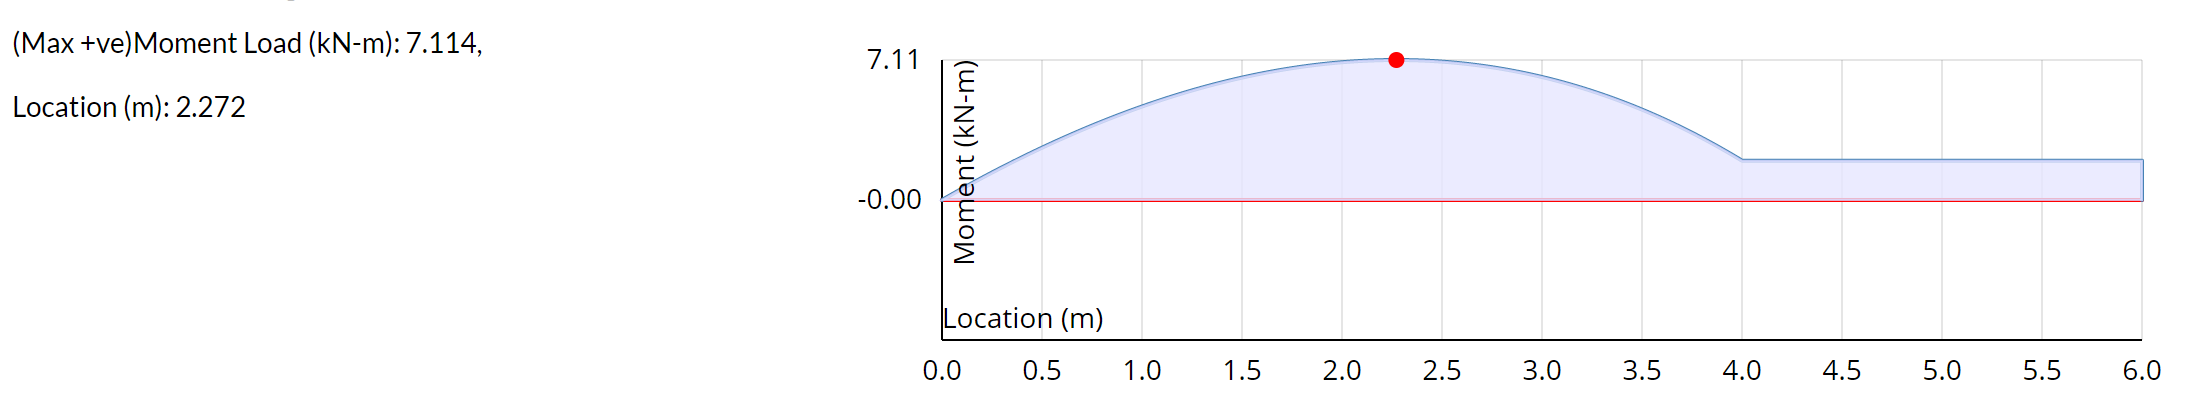
Bending Moment Diagram:
The Bending Moment Diagram of your model is presented with the results. The bending moment values are plotted against the length of the beam.
The diagram has the extreme bending moment points shown with red dots. A summary of the extreme points is shown to the left of the diagram.
You can determine the bending moment at any point along the beam span by hovering the mouse along the diagram.
Slope Diagram:
The Slope Diagram of your model is presented with the results. The slope (degrees) values are plotted against the length of the beam.
The diagram has the extreme slope points shown with red dots. A summary of the extreme points is shown to the left of the diagram.
You can determine the slope at any point along the beam span by hovering the mouse along the diagram.

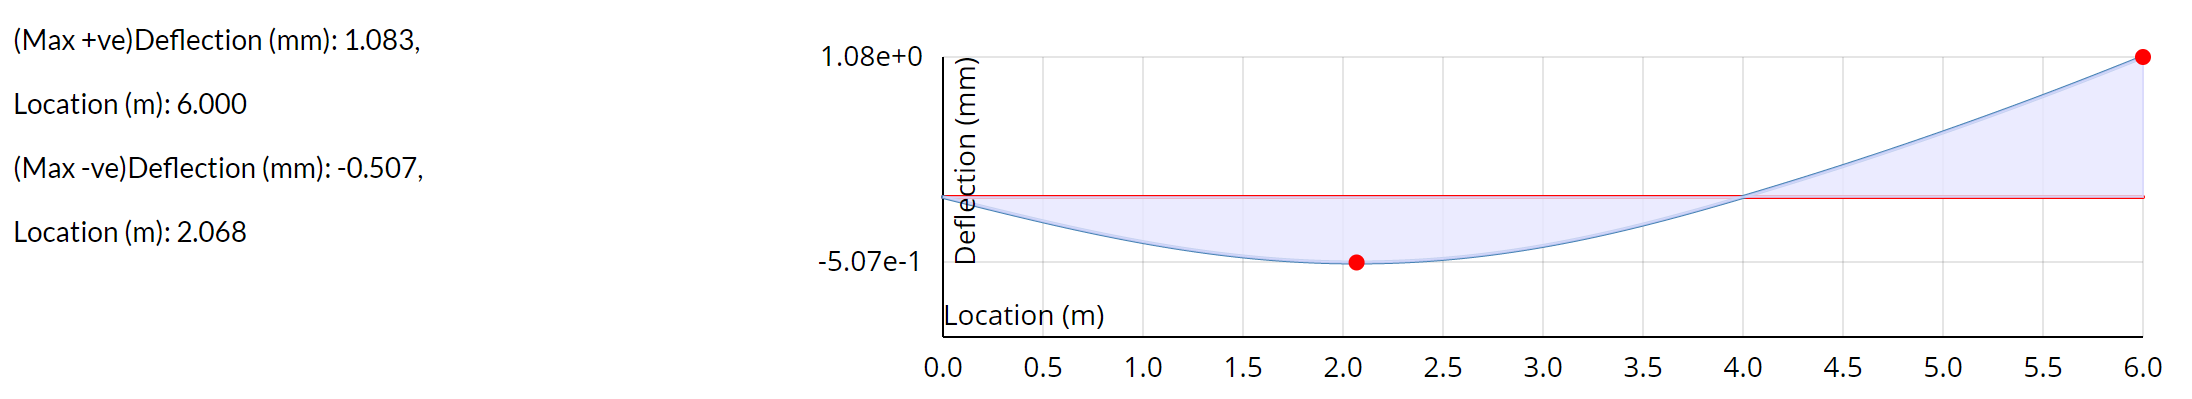
Deflection Diagram:
The Deflection Diagram of your model is presented with the results. The deflection values are plotted against the length of the beam.
Deflection unit is always Millimeters (mm) for the metric system and Inches (in) for the imperial system.
The diagram has the extreme deflection points shown with red dots. A summary of the extreme points is shown to the left of the diagram.
You can determine the deflection at any point along the beam span by hovering the mouse along the diagram.
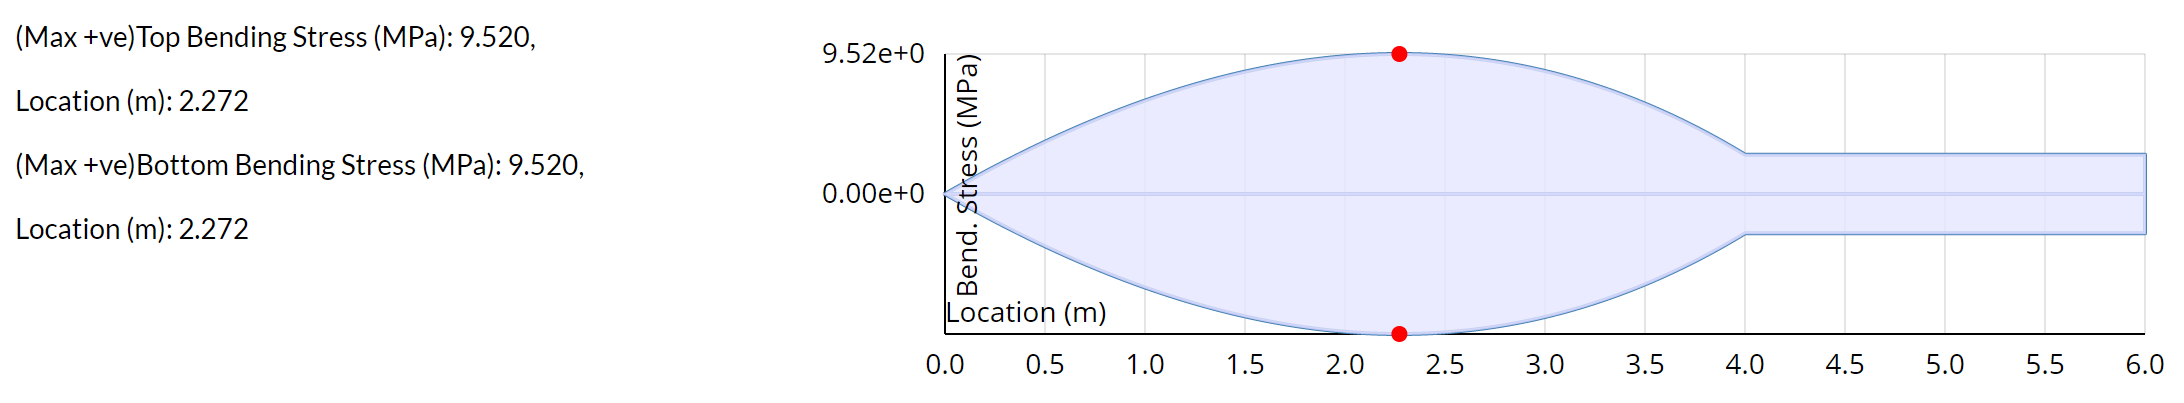
Bending Stress Diagram:
The Bending Stress Diagram of your model is presented with the results. The bending stress values are plotted against the length of the beam.
Bending stress unit is always Megapascal (MPa) for the metric system and Kilopound per square inch (ksi) for the imperial system.
The diagram has the extreme bending stress points shown with red dots. A summary of the extreme points is shown to the left of the diagram.
You can determine the bending stress at any point along the beam span by hovering the mouse along the diagram.
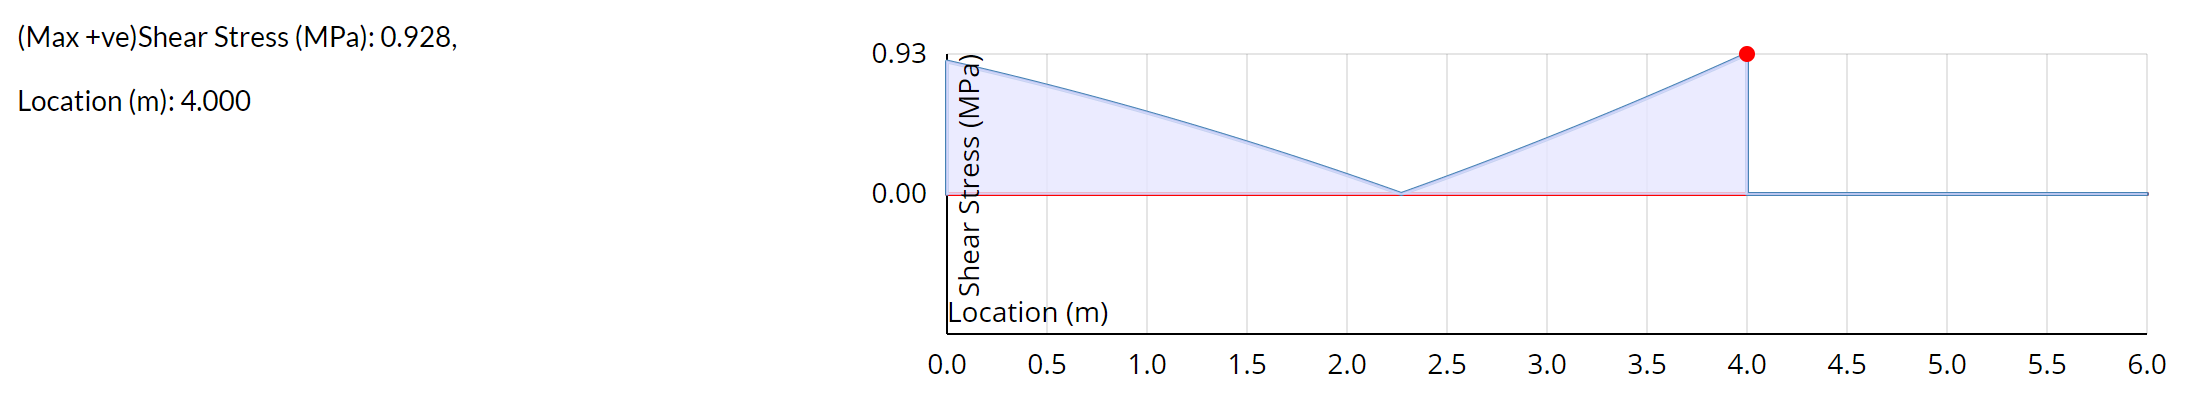
Shear Stress Diagram:
The Shear Stress Diagram of your model is presented with the results. The shear stress values are plotted against the length of the beam.
Shear stress unit is always Megapascal (MPa) for the metric system and Kilopound per square inch (ksi) for the imperial system.
The diagram has the extreme shear stress points shown with red dots. A summary of the extreme points is shown to the left of the diagram.
You can determine the shear stress at any point along the beam span by hovering the mouse along the diagram.